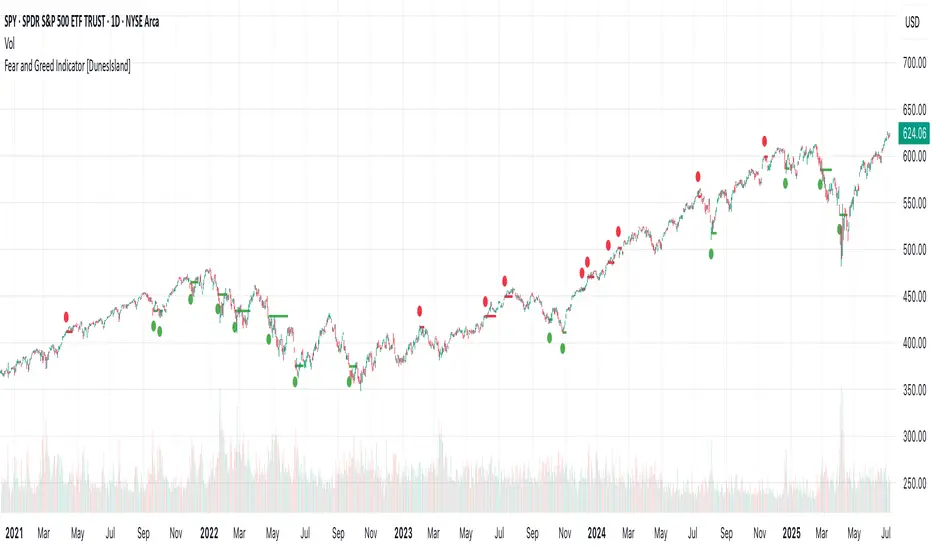
Fear and Greed Indicator [DunesIsland]The Fear and Greed Indicator is a TradingView indicator that measures market sentiment using five metrics. It displays:
Tiny green circles below candles when the market is in "Extreme Fear" (index ≤ 25), signalling potential buys.
Tiny red circles above candles when the market is in "Greed" (index > 75), indicating potential sells.
Purpose: Helps traders spot market extremes for contrarian trading opportunities.Components (each weighted 20%):
Market Momentum: S&P 500 (SPX) vs. its 125-day SMA, normalized over 252 days.
Stock Price Strength: Net NYSE 52-week highs (INDEX:HIGN) minus lows (INDEX:LOWN), normalized.
Put/Call Ratio: 5-day SMA of Put/Call Ratio (USI:PC).
Market Volatility: VIX (VIX), inverted and normalized.
Stochastic RSI: 14-period RSI on SPX with 3-period Stochastic SMA.
Alerts:
Buy: Index ≤ 25 ("Extreme Fear - Potential Buy").
Sell: Index > 75 ("Greed - Potential Sell").
Indicateurs et stratégies
EMA-Pack MTFEMA-Pack MTF
This TradingView Pine Script defines a custom indicator called "EMA-Pack MTF" that overlays various types of moving averages and Bollinger Bands across multiple timeframes on a chart. It begins by importing the built-in technical analysis library and defining a custom ma function that calculates several types of moving averages (SMA, EMA, TEMA, DEMA, HMA, and ALMA) based on user input. The ema function is the core logic, retrieving market data for the specified timeframe and calculating fast, mid, slow, 50, 100, and 200-period moving averages along with Bollinger Band components (basis, upper, and lower bands). The function adjusts values to the nearest valid price tick and returns them.
User input fields allow customization of timeframes, source data, moving average types, and Bollinger Band parameters. The script calls the ema function for each selected timeframe (1 minute, 5 minutes, 15 minutes, 1 hour, 4 hours, and 1 day), storing their respective computed values. It then plots the calculated moving averages and Bollinger Band basis lines on the chart, using different colors and line widths to distinguish between them. Some plots are hidden by default (display.none) to reduce chart clutter. This script is useful for multi-timeframe trend analysis using customizable moving averages and Bollinger Bands.

Intraday Reversal Pro1. CALL (Long/Buy) Setup
Green "CALL" label appears below a candle:
The system thinks a bullish reversal is likely.
This happens when there’s a liquidity sweep (price sweeps below recent lows), an FVG (Fair Value Gap) below price, RSI is oversold, and short-term EMA is above the long-term EMA.
Red dashed line (Stop Loss):
This is your suggested stop loss (for a call/long option) — place it at or just below this line.
Green dashed line (Take Profit):
This is your suggested take profit (for the option) — consider exiting here for a 2:1 reward/risk trade.
2. PUT (Short/Sell) Setup
Red "PUT" label appears above a candle:
The system thinks a bearish reversal is likely.
This happens when there’s a liquidity sweep above recent highs, an FVG above price, RSI is overbought, and short-term EMA is below the long-term EMA.
Red dashed line (Stop Loss):
This is your suggested stop loss (for a put/short option) — place it at or just above this line.
Green dashed line (Take Profit):
This is your suggested take profit (for the put/short option).
How to Trade with It:
Wait for a CALL or PUT label to appear (ideally after a sweep + FVG).
Enter your option position at/near the signal candle close.
Set your stop loss at the red dashed line (for calls, below; for puts, above).
Take profit at the green dashed line.
Optional: Use alerts to be notified when a new signal appears.

ADX_Power_IndikatorThe ADX Power Indicator is a technical analysis tool based on the well-known Average Directional Index (ADX) developed by Welles Wilder.
This script visualizes the core components of the ADX system – +DI, –DI, and ADX – in a clean and focused way. It emphasizes the crossovers between +DI and –DI, which can serve as potential entry or exit signals.
🔍 Features
Plots the ADX line as a stepped line to represent trend strength
Displays +DI (green) and –DI (red) lines clearly
Highlights important crossovers with colored crosses:
✅ Buy signal: +DI crosses above –DI (green cross)
❌ Sell signal: –DI crosses above +DI (red cross)
Clean and minimalistic layout – great for combining with other strategies
📈 How to Use
This indicator is ideal for traders who want to:
Measure trend strength using ADX
Detect trend reversals through DI crossovers
Confirm entries and exits based on momentum shifts
The default parameters (14-period DI and ADX) can be adjusted in the script to suit your trading style or market conditions.

Super Neema!🟧 Super Neema! — Multi-Timeframe EMA-9 Overlay
🔍 What is "Neema"?
The term "Neema" has recently emerged among traders such as Jeff Holden—a top proprietary trading firm trader—whose colleagues colloquially use "Neema" as shorthand for the 9-period Exponential Moving Average (EMA). Due to its increasing popularity and reliability, the phrase caught on quickly as traders needed a quick, memorable name for such an essential tool.
📚 Why the 9-EMA?
Scalping around the 9-EMA is now one of the most widely used intraday trading techniques. Traders of various experience levels frequently rely on it because it effectively highlights short-term momentum shifts.
But there's a crucial nuance: traders across different assets or market periods don't always agree on which timeframe’s 9-EMA to follow. Depending on who's currently active in the market, the dominant "Neema" could be the 1-minute, 2-minute, 3-minute, or 5-minute 9-EMA. This variation arises naturally due to differences in trader populations, risk tolerance, style, and current market conditions.
👥 Social Convention & Normative Social Influence
Trading is fundamentally a social activity, and normative social influence plays a critical role in market behavior. Traders don’t operate in isolation; they follow patterns, respond to cues, and rely on shared conventions. The popularity of any given indicator—like the 9-EMA—is not just technical, but deeply social. Traders adapt to what's socially accepted, recognizable, and effective.
Over time, these conventions shift. What once was "the standard" timeframe can subtly evolve as dominant traders or institutions shift their preferred style or timeframe, creating "variants" of established trends. Understanding this dynamic is essential for market participants because recognizing where the majority of traders currently focus gives a critical edge.
📈 Why Does This Matter? (Market Evolution & Trader Adaptability)
Market trends aren't just technical—they're social constructs. As markets evolve, participants adapt their methods to fit new norms. Traders who recognize and adapt quickly to these evolving norms gain a decisive advantage.
By clearly visualizing multiple Neemas (9-EMAs across timeframes) simultaneously, you don't merely see EMA levels—you visually sense the current social convention of the market. This heightened awareness helps you stay adaptive and flexible, aligning your strategy dynamically with the broader community of traders.
🎨 Transparency Scheme (Visual Identification):
5-minute Neema: Most opaque, brightest line (slowest, most significant trend)
3-minute Neema: Slightly more transparent
2-minute Neema: Even more transparent
1-minute Neema: Most transparent, subtle background hint (fastest, quickest reaction)
This deliberate visual hierarchy makes it intuitive to identify immediately which timeframe is currently dominant, and therefore, which timeframe other traders are using most actively.
✅ Works on:
Any timeframe, any chart. Automatically plots the 1m–5m EMA-9 lines regardless of your current chart.
🧠 Key Insight:
Markets are driven by social trends and normative influence.
Identifying the currently dominant timeframe (the Neema most respected by traders at that moment) is a powerful, socially-informed edge.
Trader adaptability isn't just technical—it's social awareness in action.
Enjoy your trading, and welcome to Super Neema! ⚡

ma rationing🧠 MA Rationing Indicator – Multi-Averaged Momentum + Divergence Zones
This script blends various moving average ratios (SMA, EMA, WMA, RMA) to create a smoothed and zero-centered momentum oscillator. Its goal is to highlight shifts in trend strength and spot possible divergences confirmed by volume.
🔍 Key Features:
• MA Ratio Core: Composite of multiple MA types across a short vs. long smoothing window, plotted against zero for trend clarity.
• Visual Acceleration Markers: Circle color intensity reflects momentum acceleration or deceleration.
• Volume-Supported Divergence: Highlights when price diverges from momentum and volume supports the signal.
• RSI Zone Highlighting: Dynamically draws boxes over RSI Overbought/Oversold regions as sentiment zones form.
• Custom Alerts: Includes alerts for zero-line crosses and divergence + volume confirmation.
This tool is designed for users seeking to combine price action, momentum, and volume into one clear visualization. It does not provide direct trade signals and should be used alongside your broader analysis.

Alpha - Combined BreakoutThis Pine Script indicator, "Alpha - Combined Breakout," is a combination between Smart Money Breakout Signals and UT Bot Alert, The UT Bot Alert indicator was initially developer by Yo_adriiiiaan
The idea of original code belongs HPotter.
This Indicator helps you identify potential trading opportunities by combining two distinct strategies: Smart Money Breakout and a modified UT Bot (likely a variation of the Ultimate Trend Bot). It provides visual signals, draws lines for potential take profit (TP) and stop loss (SL) levels, and includes a dashboard to track performance metrics.
Tutorial:
Understanding and Using the "Alpha - Combined Breakout" Indicator
This indicator is designed for traders looking for confirmation of market direction and potential entry/exit points by blending structural analysis with a trend-following oscillator.
How it Works (General Concept)
The indicator combines two main components:
Smart Money Breakout: This part identifies significant breaks in market structure, which "smart money" traders often use to gauge shifts in supply and demand. It looks for higher highs/lows or lower highs/lows and flags when these structural points are broken.
UT Bot: This is a trend-following component that generates buy and sell signals based on price action relative to an Average True Range (ATR) based trailing stop.
You can choose to use these signals independently or combined to generate trading alerts and visual cues on your chart. The dashboard provides a quick overview of how well the signals are performing based on your chosen settings and display mode.
Parameters and What They Do
Let's break down each input parameter:
1. Smart Money Inputs
These settings control how the indicator identifies market structure and breakouts.
swingSize (Market Structure Time-Horizon):
What it does: This integer value defines the number of candles used to identify significant "swing" (pivot) points—highs and lows.
Effect: A larger swingSize creates a smoother market structure, focusing on longer-term trends. This means signals might appear less frequently and with some delay but could be more reliable for higher timeframes or broader market movements. A smaller swingSize will pick up more minor market structure changes, leading to more frequent but potentially noisier signals, suitable for lower timeframes or scalping.
Analogy: Think of it like a zoom level on your market structure map. Higher values zoom out, showing only major mountain ranges. Lower values zoom in, showing every hill and bump.
bosConfType (BOS Confirmation Type):
What it does: This string input determines how a Break of Structure (BOS) is confirmed. You have two options:
'Candle Close': A breakout is confirmed only if a candle's closing price surpasses the previous swing high (for bullish) or swing low (for bearish).
'Wicks': A breakout is confirmed if any part of the candle (including its wick) surpasses the previous swing high or low.
Effect: 'Candle Close' provides stronger, more conservative confirmation, as it implies sustained price movement beyond the structure. 'Wicks' provides earlier, more aggressive signals, as it captures momentary breaches of the structure.
Analogy: Imagine a wall. 'Candle Close' means the whole person must get over the wall. 'Wicks' means even a finger touching over the top counts as a breach.
choch (Show CHoCH):
What it does: A boolean (true/false) input to enable or disable the display of "Change of Character" (CHoCH) labels. CHoCH indicates the first structural break against the current dominant trend.
Effect: When true, it helps identify early signs of a potential trend reversal, as it marks where the market's "character" (its tendency to make higher highs/lows or lower lows/highs) first changes.
BULL (Bullish Color) & BEAR (Bearish Color):
What they do: These color inputs allow you to customize the visual appearance of bullish and bearish signals and lines drawn by the Smart Money component.
Effect: Purely cosmetic, helps with visual identification on the chart.
sm_tp_sl_multiplier (SM TP/SL Multiplier (ATR)):
What it does: A float value that acts as a multiplier for the Average True Range (ATR) to calculate the Take Profit (TP) and Stop Loss (SL) levels specifically when you're in "Smart Money Only" mode. It uses the ATR calculated by the UT Bot's nLoss_ut as its base.
Effect: A higher multiplier creates wider TP/SL levels, potentially leading to fewer trades but larger wins/losses. A lower multiplier creates tighter TP/SL levels, potentially leading to more frequent but smaller wins/losses.
2. UT Bot Alerts Inputs
These parameters control the behavior and sensitivity of the UT Bot component.
a_ut (UT Key Value (Sensitivity)):
What it does: This integer value adjusts the sensitivity of the UT Bot.
Effect: A higher value makes the UT Bot less sensitive to price fluctuations, resulting in fewer and potentially more reliable signals. A lower value makes it more sensitive, generating more signals, which can include more false signals.
Analogy: Like a noise filter. Higher values filter out more noise, keeping only strong signals.
c_ut (UT ATR Period):
What it does: This integer sets the look-back period for the Average True Range (ATR) calculation used by the UT Bot. ATR measures market volatility.
Effect: This period directly influences the calculation of the nLoss_ut (which is a_ut * xATR_ut), thus defining the distance of the trailing stop loss and take profit levels. A longer period makes the ATR smoother and less reactive to sudden price spikes. A shorter period makes it more responsive.
h_ut (UT Signals from Heikin Ashi Candles):
What it does: A boolean (true/false) input to determine if the UT Bot calculations should use standard candlestick data or Heikin Ashi candlestick data.
Effect: Heikin Ashi candles smooth out price action, often making trends clearer and reducing noise. Using them for UT Bot signals can lead to smoother, potentially delayed signals that stay with a trend longer. Standard candles are more reactive to raw price changes.
3. Line Drawing Control Buttons
These crucial boolean inputs determine which type of signals will trigger the drawing of TP/SL/Entry lines and flags on your chart. They act as a priority system.
drawLinesUtOnly (Draw Lines: UT Only):
What it does: If checked (true), lines and flags will only be drawn when the UT Bot generates a buy/sell signal.
Effect: Isolates UT Bot signals for visual analysis.
drawLinesSmartMoneyOnly (Draw Lines: Smart Money Only):
What it does: If checked (true), lines and flags will only be drawn when the Smart Money Breakout logic generates a bullish/bearish breakout.
Effect: Overrides drawLinesUtOnly if both are checked. Isolates Smart Money signals.
drawLinesCombined (Draw Lines: UT & Smart Money (Combined)):
What it does: If checked (true), lines and flags will only be drawn when both a UT Bot signal AND a Smart Money Breakout signal occur on the same bar.
Effect: Overrides both drawLinesUtOnly and drawLinesSmartMoneyOnly if checked. Provides the strictest entry criteria for line drawing, looking for strong confluence.
Dashboard Metrics Explained
The dashboard provides performance statistics based on the lines drawing control button selected. For example, if "Draw Lines: UT Only" is active, the dashboard will show stats only for UT Bot signals.
Total Signals: The total number of buy or sell signals generated by the selected drawing mode.
TP1 Win Rate: The percentage of signals where the price reached Take Profit 1 (TP1) before hitting the Stop Loss.
TP2 Win Rate: The percentage of signals where the price reached Take Profit 2 (TP2) before hitting the Stop Loss.
TP3 Win Rate: The percentage of signals where the price reached Take Profit 3 (TP3) before hitting the Stop Loss. (Note: TP1, TP2, TP3 are in order of distance from entry, with TP3 being furthest.)
SL before any TP rate: This crucial metric shows the number of times the Stop Loss was hit / the percentage of total signals where the stop loss was triggered before any of the three Take Profit levels were reached. This gives you a clear picture of how often a trade resulted in a loss without ever moving into profit target territory.
Short Tutorial: How to Use the Indicator
Add to Chart: Open your TradingView chart, go to "Indicators," search for "Alpha - Combined Breakout," and add it to your chart.
Access Settings: Once added, click the gear icon next to the indicator name on your chart to open its settings.
Choose Your Signal Mode:
For UT Bot only: Uncheck "Draw Lines: Smart Money Only" and "Draw Lines: UT & Smart Money (Combined)". Ensure "Draw Lines: UT Only" is checked.
For Smart Money only: Uncheck "Draw Lines: UT Only" and "Draw Lines: UT & Smart Money (Combined)". Ensure "Draw Lines: Smart Money Only" is checked.
For Combined Signals: Check "Draw Lines: UT & Smart Money (Combined)". This will override the other two.
Adjust Parameters:
Start with default settings. Observe how the signals appear on your chosen asset and timeframe.
Refine Smart Money: If you see too many "noisy" market structure breaks, increase swingSize. If you want earlier breakouts, try "Wicks" for bosConfType.
Refine UT Bot: Adjust a_ut (Sensitivity) to get more or fewer UT Bot signals. Change c_ut (ATR Period) if you want larger or smaller TP/SL distances. Experiment with h_ut to see if Heikin Ashi smoothing suits your trading style.
Adjust TP/SL Multiplier: If using "Smart Money Only" mode, fine-tune sm_tp_sl_multiplier to set appropriate risk/reward levels.
Interpret Signals & Lines:
Buy/Sell Flags: These indicate the presence of a signal based on your selected drawing mode.
Entry Line (Blue Solid): This is where the signal was generated (usually the close price of the signal candle).
SL Line (Red/Green Solid): Your calculated stop loss level.
TP Lines (Dashed): Your three calculated take profit levels (TP1, TP2, TP3, where TP3 is the furthest target).
Smart Money Lines (BOS/CHoCH): These lines indicate horizontal levels where market structure breaks occurred. CHoCH labels might appear at the first structural break against the prior trend.
Monitor Dashboard: Pay attention to the dashboard in the top right corner. This dynamically updates to show the win rates for each TP and, crucially, the "SL before any TP rate." Use these statistics to evaluate the effectiveness of the indicator's signals under your current settings and chosen mode.
*
Set Alerts (Optional): You can set up alerts for any of the specific signals (UT Bot Long/Short, Smart Money Bullish/Bearish, or the "Line Draw" combined signals) to notify you when they occur, even if you're not actively watching the chart.
By following this tutorial, you'll be able to effectively use and customize the "Alpha - Combined Breakout" indicator to suit your trading strategy.

Range Breakout Statistics [Honestcowboy]
⯁ Overview
The Range Breakout Statistics uses a very simple system to detect ranges/consolidating markets. The principle is simple, it looks for areas where the slope of a moving average is flat compared to past values. If the moving average is flat for X amount of bars that's a range and it will draw a box.
The statistics part of the script is a bit more complicated. The aim of this script is to expand analysis of trading signals in a different way than a regular backtest. It also highlights the polyline tool, one of my favorite drawing tools on the tradingview platform.
⯁ Statistics Methods
The script has 2 different modes of analyzing a trading signals strength/robustness. It will do that for 2 signals native to the script.
Upper breakout: first price breakout at top of box, before max bars (100 bars by default)
Lower breakout: first price breakout at bottom of box, before max bars
The analysis methods themselves are straightforward and it should be possible for tradingview community to expand this type of analysis to other trading signals. This script is a demo for this analysis, yet some might still find the native signals helpful in their trading, that's why the script includes alerts for the 2 native signals. I've also added a setting to disable any data gathering, which makes script run faster if you want to automate it.
For both of the analysis methods it uses the same data, just with different calculations and drawing methods. The data set is all past price action reactions to the signals saved in a matrix. Below a chart for explaining this visually.
⯁ Method 1: Averages Projection
The idea behind this is that just showing all price action that happened after signal does not give actionable insights. It's more a spaghetti jumble mess of price action lines. So instead the script averages the data out using 3 different approaches, all selectable in the settings menu.
Geometric Average: useful as it accurately reflects compound returns over time, smoothing out the impact of large gains or losses. Accounts for volatility drift.
Arithmetic Average: a standard average calculation, can be misleading in trading due to volatility drift. It is the most basic form of averaging so I included it.
Median: useful as any big volatility huge moves after a signal does not really impact the mean as it's just the middle value of all values.
These averages are the 2 lines you will find in the middle of the projection. Having a clear difference between a lower break average and upper break average price reaction can signal significance of the trading signal instead of pure chaos.
Outside of this I also included calculations for the maximum and minimum values in the dataset. This is useful for seeing price reactions range to the signal, showing extreme losses or wins are possible. For this range I also included 2 matrices of highs and lows data. This makes it possible to draw a band between the range based on closing price and the one using high/low data.
Below is a visualisation of how the averages data is shown on chart.
⯁ Method 2: Equity Simulation
This method will feel closer to home for traders as it more closely resembles a backtest. It does not include any commissions however and also is just a visualisation of price reaction to a signal. This method will simulate what would happen if you would buy at the breakout point and hold the trade for X amount of bars. With 0 being sell at same bar close. To test robustness I've given the option to visualise Equity simulation not just for 1 simulation but a bunch of simulations.
On default settings it will draw the simulations for 0 bars holding all the way to 10 bars holding. The idea behind it is to check how stable the effect is, to have further confirmation of the significance of the signal. If price simulation line moves up on average for 0 bars all the way to 10 bars holding time that means the signal is steady.
Below is a visualisation of the Equity Simulation.
⯁ Signal filtering
For the boxes themselves where breakouts come from I've included a simple filter based on the size of the box in ATR or %. This will filter out all the boxes that are larger top to bottom than the ATR or % value you setup.
⯁ Coloring of Script
The script includes 5 color themes, each carefully created using color themes from the pantone color institute. There are no color settings or other visual settings in the script, the script themes are simple and always have colors that work well together. Equity simulation uses a gradient based on lightness to color the different lines so it's easier to differentiate them while still upper breaks having a different color than lower breaks.
This script is not created to be used in conjunction with other scripts, it will force you into a background color that matches the theme. It's purpose is a research tool for systematic trading, to analyse signals in more depth.
Metaverse color theme:
⯁ Conclusion
I hope this script will help traders get a deeper understanding of how different assets react to their assets. It should be possible to convert this script into other signals if you know how to code on the platform. It is my intention to make more publications that include this type of analysis. It is especially useful when dealing with signals that do not happen often enough, so a regular backtest is not enough to test their significance.

Delta Volume BubblesDelta Volume Bubbles
Overview
The Delta Volume Bubbles indicator is an advanced order flow visualization tool that displays buying and selling pressure through dynamic bubble representations on your chart. Unlike traditional volume indicators that only show total volume, this indicator calculates the net delta volume (difference between buying and selling volume) and presents it as color-coded bubbles of varying sizes.
How It Works
Core Calculation Method
The indicator uses a sophisticated approach to estimate delta volume from standard OHLCV data:
1. Price Action Analysis: Analyzes the relationship between open, high, low, and close prices to determine market aggression
2. Body Ratio Calculation: body_ratio = |close - open| / (high - low)
3. Aggressive Factor: Applies multipliers based on price action:
- Strong moves (body_ratio > 0.7): 1.5x multiplier
- Moderate moves (body_ratio > 0.4): 1.2x multiplier
- Weak moves: 1.0x multiplier
4. Delta Volume Estimation:
- Buy Volume: price_change > 0 ? volume × aggressive_factor : 0
- Sell Volume: price_change < 0 ? volume × aggressive_factor : 0
- Net Delta: buy_volume - sell_volume
5. Delta Strength Normalization: delta_strength = |net_delta| / sma(volume, 20)
Percentile-Based Filtering
The indicator uses percentile filtering instead of fixed thresholds, making it adaptive to market conditions:
- Bubble Filter: Only shows bubbles when volume exceeds the specified percentile (default: 60%)
- Label Filter: Only displays numbers when volume exceeds a higher percentile (default: 90%)
- Dynamic Adaptation: Automatically adjusts to changing market volatility
Visual Elements
Bubble Sizes
- Tiny: Delta strength < 0.3
- Small: Delta strength 0.3 - 0.7
- Normal: Delta strength 0.7 - 1.2
- Large: Delta strength 1.2 - 2.0
- Huge: Delta strength > 2.0
Color Coding
- Aggressive Buy (Bright Green): Strong buying pressure with high body ratio
- Aggressive Sell (Bright Red): Strong selling pressure with high body ratio
- Passive Buy (Light Green): Moderate buying pressure
- Passive Sell (Light Red): Moderate selling pressure
Intensity Mode
Alternative coloring based on delta strength rather than flow direction:
- Gray: Low intensity (< 0.5)
- Blue: Medium intensity (0.5 - 1.0)
- Orange: High intensity (1.0 - 2.0)
- Red: Extreme intensity (> 2.0)
Parameters
Order Flow Settings
- Show Bubbles: Toggle bubble display on/off
- Bubble Volume %ile: Percentile threshold for bubble display (0-100%)
- Intensity Mode: Switch between flow-based and intensity-based coloring
Bubble Labels
- Show Numbers in Bubbles: Toggle numerical labels on/off
- Label Volume %ile: Higher percentile threshold for label display (0-100%)
Numbers are displayed in K-notation (e.g., 25000 → 25K, 1500000 → 1.5M) for better readability.
Ideal Usage Scenarios
Best Market Conditions
- High volume sessions: More accurate delta calculations
- Trending markets: Clear directional flow identification
- Breakout scenarios: Spot aggressive buying/selling at key levels
- Support/resistance testing: Identify accumulation vs distribution
Trading Applications
1. Entry Timing: Look for aggressive flow in your trade direction
2. Exit Signals: Watch for opposing aggressive flow
3. Trend Confirmation: Consistent flow direction confirms trends
4. Volume Climax: Huge bubbles may indicate exhaustion points
Optimization Tips
Parameter Adjustment
- Lower percentiles (40-60%): More bubbles, good for active markets
- Higher percentiles (70-90%): Fewer bubbles, focus on significant events
- Label percentile: Set 20-30% higher than bubble percentile for clarity
Visual Optimization
- Intensity mode: Better for identifying unusual volume spikes
- Flow mode: Better for directional bias analysis
- Label toggle: Turn off in crowded markets, on for key levels
Limitations
- Estimation-based: Uses approximation algorithms, not true order flow data
- Volume dependency: Requires accurate volume data to function properly
- Timeframe sensitivity: Works best on intraday timeframes with active volume
- Market hours: Most effective during high-volume trading sessions
Technical Notes
The indicator implements advanced Pine Script features including:
- Dynamic percentile calculations using ta.percentile_linear_interpolation()
- Conditional plotting with multiple size categories
- Custom number formatting functions
- Efficient label management to prevent display limits
This tool is designed for traders who want to understand the underlying buying and selling pressure beyond simple volume analysis, providing insights into market sentiment and potential turning points.

Golden Pocket Syndicate [GPS]Golden Pocket Syndicate is a multi-layered market analysis toolkit built for precision entries and sniper-style reversals in both trending and ranging conditions. The script fuses volume dynamics, golden pocket structures, market maker behavior, and liquidation cluster tracking into one high-confluence system.
Core Features:
• 📐 Golden Pocket Zones: Dynamic GP levels from daily, weekly, monthly, and yearly timeframes. These levels update in real-time and serve as confluence zones for entries and exits.
• 📊 WaveTrend Divergence Diamonds: Momentum shifts are detected using a custom filtered WaveTrend cross system to mark high-probability reversal conditions.
• 🧠 Market Maker Premium Divergence: Tracks price dislocation between CME and Binance to detect large player manipulation using a configurable premium threshold.
• 💎 MM Reversal Diamonds: Identifies potential market maker traps and large player pivots using historical candle behavior, EMA alignment, and price structure breaks.
• 📉 Stealth Liquidation Cluster Arrows: Volume-based liquidation pressure visualized as lightweight directional arrows based on calculated wick expansion and volume bursts. Highlights key zones where price is likely to bounce or reject.
• 🧭 Trend Validation: Uses volume-based trend conditions and short-term EMA positioning to further qualify signals and eliminate noise.
How to Use:
This indicator is designed to help traders visualize confluence between key institutional price levels, momentum shifts, and volume-based pressure points. Long/short opportunities can be explored at marked reversal diamonds or liquidation zones that align with key GP levels. Intended for use on higher timeframes (15m to 4H), though flexible across any pair or market.

HL/OL Histogram + (Close-Open)🧠 Core Concept
This indicator is designed to detect meaningful directional intent in price action using a combination of:
Intrabar candle structure (high - open, open - low)
Net price momentum (close - open)
Timed trigger levels (frozen buy/sell prices based on selected timeframe closes)
The core idea is to visually separate bullish and bearish energy in the current bar, and to mark the price at which momentum flips from down to up or vice versa, based on a change in the close - open differential.
🔍 Components Breakdown
1. Histogram Bars
Green Bars (high - open): Represent bullish upper wicks, showing intrabar strength above the open.
Red Bars (open - low): Represent bearish lower wicks, showing pressure below the open.
Plotted as histograms above and below the zero line.
2. Close–Open Line (White)
Plots the difference between close and open for each bar.
Helps you visually track when momentum flips from negative to positive, or vice versa.
A bold black zero line provides clear reference for these flips.
3. Buy/Sell Signal Logic
A Buy Trigger is generated when close - open crosses above zero
A Sell Trigger occurs when close - open crosses below zero
These trigger events are one-shot, meaning they’re only registered once per signal direction. No retriggers occur until the opposite condition is met.
📈 Trigger Price Table (Static)
On a signal trigger, the close price from a lower timeframe (15S, 30S, 1, 2, 3, or 5 min) is captured.
This price is frozen and displayed in a table at the top-right of the pane.
The price remains fixed until the opposite trigger condition fires, at which point it is replaced.
Why close price?
Using the close from the lower timeframe gives a precise, decisive reference point — ideal for planning limit entries or confirming breakout commitment.
🛠️ Use Cases
Momentum traders can use the histogram and line to time entries after strong open rejection or close breakouts.
Scalpers can quickly gauge intrabar sentiment reversals and react to new momentum without waiting for candle closes.
Algo builders can use the frozen price logic as precise entry or confirmation points in automated strategies.

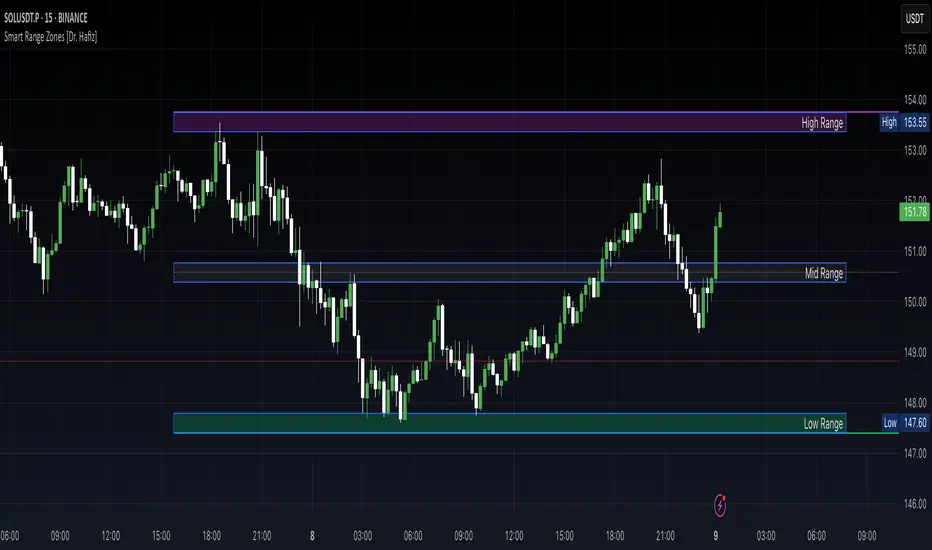
Smart Range Zones [Dr. Hafiz]Smart Range Zones
Description:
This indicator highlights key market zones — High Range, Mid Range, and Low Range — to help traders visually understand dynamic support and resistance levels.
✅ High Range: Potential supply/resistance area
✅ Mid Range: Fair value or equilibrium zone
✅ Low Range: Potential demand/support area
The zones are calculated based on the highest and lowest price over a user-defined period (default: 130 bars) and dynamically projected forward.
🔸 EMA 15 Line is included as an optional trend filter — helping confirm direction or trend alignment.
🔧 Features:
Auto-calculated High/Mid/Low zones
Real-time dynamic projections
Right-aligned zone labels inside each box
Clean visual structure
Toggle for showing/hiding EMA 15
📌 Best suited for:
Intraday & swing traders
Range breakouts and rejections
Trend confirmation with EMA
Created and published by Dr. Hafiz, modified under the MPL 2.0 license.
FVG Strategy [algo ] - 0.10% TP/SL📈 FVG Strategy Algo-Based] – 0.10% TP/SL
This strategy is based on Fair Value Gaps (FVGs), inspired by Smart Money Concepts (SMC) and institutional price inefficiencies.
✅ How It Works:
Bullish FVG: A long entry is triggered when the price re-enters a bullish FVG zone.
Bearish FVG: A short entry is triggered when the price re-enters a bearish FVG zone.
Stop Loss: Set at 0.10% below (long) or above (short) the entry price.
Take Profit: Set at 0.10% above (long) or below (short) the entry price.
This setup is ideal for scalpers and algo traders looking to capitalize on micro-imbalances with very tight risk control.
⚙️ Strategy Inputs:
🔹 Timeframe selection
🔹 Optional threshold filter for gap size
🔹 No repainting logic
🔹 0.10% fixed SL & TP for every trade
📊 Best Use:
Lower timeframes (1m, 3m, 5m)
Trending or volatile markets
Combine with trend filters for higher accuracy

Implied SPX from ES Implied SPX from ES Futures (ETH)
Description:
This script calculates the implied SPX index level based on real-time ES futures pricing during extended trading hours (ETH). It uses the spread between the previous day’s ES and SPX RTH closes to adjust for fair value and intraday divergence.
📈 Features:
Tracks current ES price vs. yesterday's RTH spread to estimate SPX
Useful for SPX options traders who want to monitor synthetic index levels during ETH
Ideal for assessing SPX movement when the cash market is closed
This tool is especially helpful for those trading SPX index options overnight or seeking to align SPX levels with ES futures movement.

Multy Dynamic POCThis script displays up to 4 independent Point of Control (POC) levels based on volume profile logic.
📌 Each POC can be configured individually:
Period options: Daily (D), Weekly (W), Monthly (M), or BARS (rolling bar window).
Dynamic recalculation when the period changes (e.g., new day/week/month or custom bar count).
Price-anchored lines for each POC level that scale correctly with the chart.
Customizable line color and thickness.
🔍 How it works:
For each active POC line, the script builds a simple volume distribution based on the candle’s average price (hl2) and volume.
The price range is split into 100 buckets. The one with the highest accumulated volume is selected as the Point of Control (POC).
In BARS mode, POC is recalculated every N bars. In D/W/M modes, it resets exactly at the beginning of a new period (according to TradingView’s time() function).
✅ Useful for:
Traders applying volume profile analysis without needing the full built-in volume profile tool.
Spotting dynamic high-volume zones in trends or ranges.
Strategy development or confirmation around high-interest price levels.
_______________________________________________________________________________
Данный индикатор отображает до 4 независимых уровней Point of Control (POC), рассчитанных по объёмам.
📌 Каждый POC можно настраивать отдельно:
Периоды: День (D), Неделя (W), Месяц (M) или BARS (скользящее окно по количеству баров).
Автоматический пересчёт при смене периода (например, новый день, неделя или месяц).
Линии POC привязаны к цене и масштабируются вместе с графиком.
Настраиваемый цвет и толщина линий.
🔍 Как работает:
Для каждой активной линии POC создаётся объёмное распределение: берется средняя цена свечи (hl2) и объем.
Диапазон цен делится на 100 уровней. Тот, где накоплено больше всего объёма, и есть POC.
В режиме BARS уровень пересчитывается каждые N баров. В режимах D/W/M — строго в начале нового периода.
✅ Подходит для:
Трейдеров, использующих объёмный анализ, но не имеющих платной подписки на Volume Profile.
Поиска уровней интереса и подтверждения сигналов.
Разработки стратегий с опорой на объём.

SMA Crossover Strategy with TP/SL📊 Strategy Description: SMA Crossover Strategy with TP/SL
This is a Simple Moving Average (SMA) Crossover Strategy designed to help traders identify trend reversals and manage trades with proper risk-reward logic.
🔹 Entry Logic:
Buy Signal: When the Fast SMA crosses above the Slow SMA → indicating a bullish trend.
Sell Signal: When the Fast SMA crosses below the Slow SMA → indicating a bearish trend.
🔹 Exit Logic:
Take Profit: The strategy exits the position when price reaches a user-defined profit target.
Stop Loss: The trade is closed if price moves against the position beyond the specified stop-loss limit.
⚙️ Parameters:
Fast SMA Length: Number of candles used for fast moving average (default: 10)
Slow SMA Length: Number of candles used for slow moving average (default: 30)
Take Profit (%): Profit target in percentage (default: 0.10%)
Stop Loss (%): Maximum allowed loss per trade (default: 0.10%)
✅ Additional Features:
Strategy backtesting supported
Visual arrows for Buy/Sell signals
Bar coloring based on trend
Alert conditions for Buy/Sell crossover signals
🧠 Suggested Use:
Works best on 1 min, 5 hour, or daily timeframes.
Can be applied to stocks, crypto, forex, or indices.
Ideal for trend-following traders who want automation with risk control.

Short Only | EMA100 + MACD + Bearish Candle | Risk 3:1
This strategy is designed for short trades only on any market (crypto, forex, stocks).
It combines three simple but effective conditions:
Price below EMA100 – confirms downtrend.
MACD Line crosses below Signal Line and is bearish – momentum confirmation.
Bearish candle pattern – confirms entry timing.
Risk/Reward is set to 1:3, using ATR-based dynamic take profit and stop loss.
Works well on 30m to 1h timeframes.
Suitable for crypto pairs and volatile instruments.

Time Period Highlighter V2This indicator highlights custom time periods on any intraday chart in TradingView, making it easier to visualize your preferred trading sessions.
You can define up to three separate time ranges per day, each with precise start and end times down to the minute (e.g., 08:30 - 12:15, 14:00 - 16:45, and 20:00 - 22:30). The indicator shades the background of your chart during these periods, helping you quickly identify when you're most active or when specific market conditions occur.
Key Features:
Set start and end times (hours and minutes) for up to three trading sessions.
Automatically highlights these periods across any intraday timeframe.
Uses 24-hour time format aligned with your TradingView chart timezone.
Perfect for day traders, scalpers, or anyone needing clear visual cues for their trading windows.
This tool is especially useful for reviewing trading strategies, backtesting, or ensuring you're focusing on high-probability market hours.
Tip: Double-check that your chart timezone matches your desired session times for accurate highlighting.

Padre's FVG (Dynamic + Fill Shrink)a dynamic FVG fill up. Marks out FVGs and shrinks them as the gap is filled.

ATR as % of Close (Daily)Sometimes, ATR is more comparable and meaningful when we express it in % rather than dollar. This is a quickly developed version (using ChatGPT), so review it and use it with caution, although the calculation is quite straightforward.

Position Size Calculator with Fees# Position Size Calculator with Portfolio Management - Manual
## Overview
The Position Size Calculator with Portfolio Management is an advanced Pine Script indicator designed to help traders calculate optimal position sizes based on their total portfolio value and risk management strategy. This tool automatically calculates your risk amount based on portfolio allocation percentages and determines the exact position size needed while accounting for trading fees.
## Key Features
- **Portfolio-Based Risk Management**: Calculates risk based on total portfolio value
- **Tiered Risk Allocation**: Separates trading allocation from total portfolio
- **Automatic Trade Direction Detection**: Determines long/short based on entry vs stop loss
- **Fee Integration**: Accounts for trading fees in position size calculations
- **Risk Factor Adjustment**: Allows scaling of position size up or down
- **Visual Display**: Shows all calculations in a clear, color-coded table
- **Automatic Risk Calculation**: No need to manually input risk amount
## Input Parameters
### Total Portfolio ($)
- **Purpose**: The total value of your investment portfolio
- **Default**: 0.0
- **Range**: Any positive value
- **Step**: 0.01
- **Example**: If your total portfolio is worth $100,000, enter 100000
### Trading Portfolio Allocation (%)
- **Purpose**: The percentage of your total portfolio allocated to active trading
- **Default**: 20.0%
- **Range**: 0.0% to 100.0%
- **Step**: 0.01
- **Example**: If you allocate 20% of your portfolio to trading, enter 20
### Risk from Trading (%)
- **Purpose**: The percentage of your trading allocation you're willing to risk per trade
- **Default**: 0.1%
- **Range**: Any positive value
- **Step**: 0.01
- **Example**: If you risk 0.1% of your trading allocation per trade, enter 0.1
### Entry Price ($)
- **Purpose**: The price at which you plan to enter the trade
- **Default**: 0.0
- **Range**: Any positive value
- **Step**: 0.01
### Stop Loss ($)
- **Purpose**: The price at which you will exit if the trade goes against you
- **Default**: 0.0
- **Range**: Any positive value
- **Step**: 0.01
### Risk Factor
- **Purpose**: A multiplier to scale your position size up or down
- **Default**: 1.0 (no scaling)
- **Range**: 0.0 to 10.0
- **Step**: 0.1
- **Examples**:
- 1.0 = Normal position size
- 2.0 = Double the position size
- 0.5 = Half the position size
### Fee (%)
- **Purpose**: The percentage fee charged per transaction
- **Default**: 0.01% (0.01)
- **Range**: 0.0% to 1.0%
- **Step**: 0.001
## How Risk Amount is Calculated
The script automatically calculates your risk amount using this formula:
```
Risk Amount = Total Portfolio × Trading Allocation (%) × Risk % ÷ 10,000
```
### Example Calculation:
- Total Portfolio: $100,000
- Trading Allocation: 20%
- Risk per Trade: 0.1%
**Risk Amount = $100,000 × 20 × 0.1 ÷ 10,000 = $20**
This means you would risk $20 per trade, which is 0.1% of your $20,000 trading allocation.
## Portfolio Structure Example
Let's say you have a $100,000 portfolio:
### Allocation Structure:
- **Total Portfolio**: $100,000
- **Trading Allocation (20%)**: $20,000
- **Long-term Investments (80%)**: $80,000
### Risk Management:
- **Risk per Trade (0.1% of trading)**: $20
- **Maximum trades at risk**: Could theoretically have 1,000 trades before risking entire trading allocation
## How Position Size is Calculated
### Trade Direction Detection
- **Long Trade**: Entry price > Stop loss price
- **Short Trade**: Entry price < Stop loss price
### Position Size Formulas
#### For Long Trades:
```
Position Size = -Risk Factor × Risk Amount / (Stop Loss × (1 - Fee) - Entry Price × (1 + Fee))
```
#### For Short Trades:
```
Position Size = -Risk Factor × Risk Amount / (Entry Price × (1 - Fee) - Stop Loss × (1 + Fee))
```
## Output Display
The indicator displays a comprehensive table with color-coded sections:
### Portfolio Information (Light Blue Background)
- **Portfolio (USD)**: Your total portfolio value
- **Trading Portfolio Allocation (%)**: Percentage allocated to trading
- **Risk as % of Trading**: Risk percentage per trade
### Trade Setup (Gray Background)
- **Entry Price**: Your specified entry price
- **Stop Loss**: Your specified stop loss price
- **Fee (%)**: Trading fee percentage
- **Risk Factor**: Position size multiplier
### Risk Analysis (Red Background)
- **Risk Amount**: Automatically calculated dollar risk
- **Effective Entry**: Actual entry cost including fees
- **Effective Exit**: Actual exit value including fees
- **Expected Loss**: Calculated loss if stop loss is hit
- **Deviation from Risk %**: Accuracy of risk calculation
### Final Result (Blue Background)
- **Position Size**: Number of shares/units to trade
## Usage Examples
### Example 1: Conservative Long Trade
- **Total Portfolio**: $50,000
- **Trading Allocation**: 15%
- **Risk per Trade**: 0.05%
- **Entry Price**: $25.00
- **Stop Loss**: $24.00
- **Risk Factor**: 1.0
- **Fee**: 0.01%
**Calculated Risk Amount**: $50,000 × 15% × 0.05% ÷ 100 = $3.75
### Example 2: Aggressive Short Trade
- **Total Portfolio**: $200,000
- **Trading Allocation**: 30%
- **Risk per Trade**: 0.2%
- **Entry Price**: $150.00
- **Stop Loss**: $155.00
- **Risk Factor**: 2.0
- **Fee**: 0.01%
**Calculated Risk Amount**: $200,000 × 30% × 0.2% ÷ 100 = $120
**Actual Risk**: $120 × 2.0 = $240 (due to risk factor)
## Color Coding System
- **Green/Red Header**: Trade direction (Long/Short)
- **Light Blue**: Portfolio management parameters
- **Gray**: Trade setup parameters
- **Red**: Risk-related calculations and results
- **Blue**: Final position size result
## Best Practices
### Portfolio Management
1. **Keep trading allocation reasonable** (typically 10-30% of total portfolio)
2. **Use conservative risk percentages** (0.05-0.2% per trade)
3. **Don't risk more than you can afford to lose**
### Risk Management
1. **Start with small risk factors** (1.0 or less) until comfortable
2. **Monitor your total exposure** across all open positions
3. **Adjust risk based on market conditions**
### Trade Execution
1. **Always validate calculations** before placing trades
2. **Account for slippage** in volatile markets
3. **Consider position size relative to liquidity**
## Risk Management Guidelines
### Conservative Approach
- Trading Allocation: 10-20%
- Risk per Trade: 0.05-0.1%
- Risk Factor: 0.5-1.0
### Moderate Approach
- Trading Allocation: 20-30%
- Risk per Trade: 0.1-0.15%
- Risk Factor: 1.0-1.5
### Aggressive Approach
- Trading Allocation: 30-40%
- Risk per Trade: 0.15-0.25%
- Risk Factor: 1.5-2.0
## Troubleshooting
### Common Issues
1. **Position Size shows 0**
- Verify all portfolio inputs are greater than 0
- Check that entry price differs from stop loss
- Ensure calculated risk amount is positive
2. **Very small position sizes**
- Increase risk percentage or risk factor
- Check if your risk amount is too small for the price difference
3. **Large risk deviation**
- Normal for very small positions
- Consider adjusting entry/stop loss levels
### Validation Checklist
- Total portfolio value is realistic
- Trading allocation percentage makes sense
- Risk percentage is conservative
- Entry and stop loss prices are valid
- Trade direction matches your intention
## Advanced Features
### Risk Factor Usage
- **Scaling up**: Use risk factors > 1.0 for high-confidence trades
- **Scaling down**: Use risk factors < 1.0 for uncertain trades
- **Never exceed**: Risk factors that would risk more than your comfort level
### Multiple Timeframe Analysis
- Use different risk factors for different timeframes
- Consider correlation between positions
- Adjust trading allocation based on market conditions
## Disclaimer
This tool is for educational and planning purposes only. Always verify calculations manually and consider market conditions, liquidity, and correlation between positions. The automated risk calculation assumes you're comfortable with the mathematical relationship between portfolio allocation and individual trade risk. Past performance doesn't guarantee future results, and all trading involves risk of loss.

MA Crossover Strategy with TP/SL (5 EMA Filter)How the Strategy Works on a 5-Minute Chart:
Data Input (5-Minute Candles):
Every single data point (candle) on your chart will represent 5 minutes of price action (Open, High, Low, Close for that 5-minute period).
All calculations (MAs, EMA, signals) will be based on these 5-minute price data points.
Moving Average Calculations:
Fast MA (10-period SMA): This will be the Simple Moving Average of the closing prices of the last 10 five-minute candles. It reacts relatively quickly to recent price changes.
Slow MA (30-period SMA): This will be the Simple Moving Average of the closing prices of the last 30 five-minute candles. It represents a slightly longer-term trend compared to the Fast MA.
5 EMA (5-period EMA): This is the Exponential Moving Average of the closing prices of the last 5 five-minute candles. Being an EMA, it gives more weight to the most recent 5-minute prices, making it very responsive to immediate price action.
Signal Generation (Entry Conditions):
Long Entry Signal:
The 10-period SMA crosses above the 30-period SMA (indicating a potential bullish shift in the short-to-medium term trend).
AND the current 5-minute candle's closing price is above the 5-period EMA (confirming that the immediate price momentum is also bullish and supporting the crossover).
If both conditions are met at the close of a 5-minute candle, a "Buy" signal is generated.
Short Entry Signal:
The 10-period SMA crosses below the 30-period SMA (indicating a potential bearish shift).
AND the current 5-minute candle's closing price is below the 5-period EMA (confirming immediate bearish momentum).
If both conditions are met at the close of a 5-minute candle, a "Sell" signal is generated.
Trade Execution:
When a signal is triggered, the strategy enters a trade (long or short) at the closing price of that 5-minute candle.
Immediately upon entry, it places two contingent orders:
Take Profit (Target): Set at 2% (by default) away from your entry price. For a long trade, it's 2% above; for a short trade, 2% below.
Stop Loss: Set at 1% (by default) away from your entry price. For a long trade, it's 1% below; for a short trade, 1% above.
The trade will remain open until either the Take Profit or Stop Loss price is hit by subsequent 5-minute candles.
Implications for Trading on a 5-Minute Chart:
Increased Trade Frequency: You will likely see many more signals and trades compared to higher timeframes (like 1-hour or daily charts). This means more potential opportunities but also more transaction costs (commissions, slippage).
Sensitivity to Noise: Lower timeframes are more prone to "market noise" – small, random price fluctuations that don't indicate a true trend. While the 5 EMA filter helps, some false signals might still occur.
Faster Price Action: Price movements can be very rapid on a 5-minute chart. Your take profit or stop loss levels might be hit very quickly, sometimes within the same or next few candles.
Parameter Optimization is Crucial: The default MA lengths (10, 30) and EMA (5) might not be optimal for every asset or market condition on a 5-minute chart. You'll need to backtest extensively and potentially adjust these lengths, as well as the targetPerc and stopPerc, to find what works best for the specific instrument you're trading.
Risk Management: The fixed percentage stop loss is vital on a 5-minute chart due to its volatility. Without it, a few unfavorable moves could lead to significant losses.

Easy Position Size Calculator with Fees# Easy Position Size Calculator with Fees - Manual
## Overview
The Easy Position Size Calculator is a Pine Script indicator designed to help traders calculate the optimal position size for their trades while accounting for trading fees. This tool automatically determines whether you're planning a long or short position and calculates the exact position size needed to risk a specific dollar amount.
## Key Features
- **Automatic Trade Direction Detection**: Determines if you're going long or short based on entry price vs stop loss
- **Fee Integration**: Accounts for trading fees in position size calculations
- **Risk Management**: Calculates position size based on your specified risk amount
- **Risk Factor Adjustment**: Allows you to scale your position size up or down
- **Visual Display**: Shows all calculations in a clear, organized table
## Input Parameters
### Entry Price ($)
- **Purpose**: The price at which you plan to enter the trade
- **Default**: 0.0
- **Range**: Any positive value
- **Step**: 0.01
### Stop Loss ($)
- **Purpose**: The price at which you will exit the trade if it goes against you
- **Default**: 0.0
- **Range**: Any positive value
- **Step**: 0.01
### Risk ($)
- **Purpose**: The maximum dollar amount you're willing to lose on this trade
- **Default**: 0.0
- **Range**: Any positive value
- **Step**: 0.01
### Risk Factor
- **Purpose**: A multiplier to scale your position size up or down
- **Default**: 1.0 (no scaling)
- **Range**: 0.0 to 10.0
- **Step**: 0.1
- **Examples**:
- 1.0 = Normal position size
- 2.0 = Double the position size
- 0.5 = Half the position size
### Fee (%)
- **Purpose**: The percentage fee charged per transaction (buy/sell)
- **Default**: 0.01% (0.01)
- **Range**: 0.0% to 1.0%
- **Step**: 0.001
## How It Works
### Trade Direction Detection
The script automatically determines your trade direction:
- **Long Trade**: Entry price > Stop loss price
- **Short Trade**: Entry price < Stop loss price
### Position Size Calculation
#### For Long Trades:
```
Position Size = -Risk Factor × Risk Amount / (Stop Loss × (1 - Fee) - Entry Price × (1 + Fee))
```
#### For Short Trades:
```
Position Size = -Risk Factor × Risk Amount / (Entry Price × (1 - Fee) - Stop Loss × (1 + Fee))
```
### Fee Adjustment
The script accounts for fees on both entry and exit:
- **Long trades**: You pay fees when buying (entry) and selling (exit)
- **Short trades**: You pay fees when shorting (entry) and covering (exit)
## Output Display
The indicator displays a table with the following information:
### Trade Information
- **Trade Type**: Shows whether it's a LONG, SHORT, or INVALID trade
- **Entry Price**: Your specified entry price
- **Stop Loss**: Your specified stop loss price
- **Fee (%)**: The fee percentage being used
### Risk Parameters
- **Risk Amount**: The dollar amount you're willing to risk
- **Risk Factor**: The multiplier being applied
### Calculated Values
- **Effective Entry**: The actual cost per share including fees
- **Effective Exit**: The actual exit value per share including fees
- **Expected Loss**: The calculated loss if stop loss is hit
- **Deviation from Risk %**: Shows how close the expected loss is to your target risk
- **Position Size**: The number of shares/units to trade
## Usage Examples
### Example 1: Long Trade
- Entry Price: $100.00
- Stop Loss: $95.00
- Risk Amount: $500.00
- Risk Factor: 1.0
- Fee: 0.01%
**Result**: The script will calculate how many shares to buy so that if the stop loss is hit, you lose approximately $500 (accounting for fees). Position Size: 99.61152
### Example 2: Short Trade
- Entry Price: $50.00
- Stop Loss: $55.00
- Risk Amount: $300.00
- Risk Factor: 1.0
- Fee: 0.01%
**Result**: The script will calculate how many shares to short so that if the stop loss is hit, you lose approximately $300 (accounting for fees). Position Size: 59.87426
## Important Notes
### Validation Requirements
For the script to work properly, all of the following must be true:
- Entry price > 0
- Stop loss > 0
- Risk amount > 0
- Entry price ≠ Stop loss (to determine direction)
### Negative Position Sizes
The script may show negative position sizes, which is normal:
- **Negative values for long trades**: Represents shares to buy
- **Negative values for short trades**: Represents shares to short
### Risk Deviation
The "Deviation from Risk %" shows how closely the calculated position size matches your target risk. Small deviations are normal due to:
- Fee calculations
- Rounding
- Market precision
## Color Coding
The table uses color coding for easy identification:
- **Green**: Long trade information
- **Red**: Short trade information
- **Gray**: Invalid trade (when inputs are incorrect)
- **Blue**: Final position size
- **Red background**: Risk-related calculations
## Troubleshooting
### Common Issues
1. **Position Size shows 0**
- Check that all inputs are greater than 0
- Ensure entry price is different from stop loss
2. **Trade Type shows INVALID**
- Verify that entry price and stop loss are both positive
- Make sure entry price ≠ stop loss
3. **Large Risk Deviation**
- This is normal for very small position sizes
- Consider adjusting your risk amount or price levels
## Best Practices
1. **Always validate your inputs** before placing actual trades
2. **Double-check the trade direction** shown in the table
3. **Review the expected loss** to ensure it aligns with your risk management
4. **Consider the effective entry/exit prices** which include fees
5. **Use appropriate risk factors** - avoid extreme values that could lead to overexposure
## Disclaimer
This tool is for educational and planning purposes only. Always verify calculations manually and consider market conditions, liquidity, and other factors before placing actual trades. The script assumes that fees are charged on both entry and exit transactions.
